

Under the new MAHA 2025–2030 U.S. Dietary Guidelines for Americans, the recommendation on added sugar has shifted compared with previous editions because research has concluded sugar has been the major culprit that causes many of the diseases we see in Americans today: from obesity to heart disease, from cancer to diabetes. The MAHA 2025-2030 Upside Down Pyramid Plan: Eat as little added sugar as you can!
https://daybydayliving.net/?p=4015
Added Sugar Recommendation in MAHA 2025–2030 Guidelines
- The guidelines state “no amount of added sugar is recommended or considered part of a healthy or nutritious diet” — encouraging avoidance of added sugars altogether.
- But, if added sugars are consumed, the MAHA guidelines suggest limiting them to no more than 10 grams per meal (about 2 teaspoons of added sugar).
What This Means for Your Daily Intake of Added Sugar
- Although there is no fixed gram-per-day sugar limit like the previous ~50 g/day rule — the focus is on minimizing or avoiding added sugars overall while keeping them to ≤10 g per meal if consumed. Translation: 3 meals/day = 30 grams/day of added sugar.
MAHA 2025-2030 Sugar Recommendation Comparison to Previous US Dietary Guidelines
- 2020–2025 US Dietary Guidelines recommended limiting added sugars to less than 10% of total daily calories (which equates to about 50 grams per day for a 2,000-calorie diet).
- MAHA 2025-2030 edition’s “10-gram per meal” rule is more restrictive in how sugar is allocated throughout eating occasions rather than as a strict daily cap.
Education is Critical in Make You and Your Family Healthy
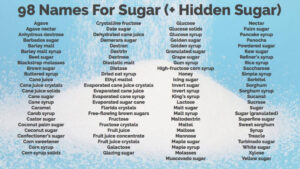
Not only do Americans need to learn how sugar affects our health negatively they need to become proactive and make smarter food choices. Parents are in control of their family’s health and most of the time moms are in charge of meals and snacks for their families. Hopefully the list below will help to see how much sugar along with calories, protein and saturated fat are in many snacks. Below is the many names for sugar you can find in the ingredient list. But you can also read the Nutrition Facts on the food label to determine how many grams of Total Sugar and grams of Added Sugar is in a serving of the food.
Nutritional Breakdown of Snacks Americans Eat*
Here’s a nutritional breakdown of some of the most popular Candy Bars in America — focusing on protein, calories, sugar, and saturated fat per serving, based on available label and manufacturer data. Where exact saturated fat info isn’t widely published, I’ve marked it as estimated or noted typical levels when possible.
Popular Candy Bars Full Size
Food | Calories (kcal) | Protein (g) | Sat-Fat (g) | Sugar(g) |
Snickers 2 oz/ 52 g | 250 kcal | 4 g | 4.5 | 28 g |
Reece’s Peanut Butter Cups 2 cups/45 g | 230 kcal | 5 g | 5 | 21 g |
3 Musketeers (60 g) | 257 kcal | 1-2 g | 7 g | 40 g |
Kit Kat 1.5 oz /42 g | 210 kcal | 3 g | 7 g | 22-23 g |
Almond Joy 44 g | 220 kcal | 2 g | 9 g | 21 g |
Reece’s Take 5 1.5 oz | 210 kcal | 3 g | 5 g | 18 g |
Butterfinger 1 bar | 250 kcal | 5 g | Not listed* | 21 g |
Hershey’s Milk Chocolate 1.55 oz | 220 kcal | 3 g | Not listed* | 25 g |
*Some bars (like Butterfinger, Hershey’s) often list total fat but omit saturated fat on summary tables — typical saturated fat is moderate (several grams).
Notes & Context Regarding Calories, Protein, Saturated Fat (Sat-Fat), Sugar
- Sugar content in these bars typically ranges from about 18–40 g per full bar, with lighter nougat bars (e.g., 3 Musketeers) often at the higher end of sugar.
- Protein is low in most classic candy bars — usually 2–5 g per bar — since they’re not designed for nutrition.
- Saturated fats vary widely depending on chocolate and fillings, roughly 4–9 g, with coconut-and-nut based bars like Almond Joy trending higher.
- Candy bars deliver calories mostly from sugar and fat rather than protein or other nutrients. Even the higher calorie ones are inducements for energy intake, not balanced nutrition.
Comparison Insight
For reference, many popular bars have more calories and sugar than protein — e.g., a typical Snickers has ~250 kcal and ~28 g sugar vs ~4 g protein.
By contrast, modern “protein bar” style snacks often aim for 15–20 g protein but may still contain significant calories and added sweeteners. (That’s a different product category from classic candy bars.)
Classic Ready-to-Drink Protein Shakes
Here’s a nutritional breakdown of some of the most popular ready-to-drink protein beverages in America — focusing on protein, calories, sugar, and saturated fat per serving, based on available label and manufacturer data. Where exact saturated fat info isn’t widely published, I’ve marked it as estimated or noted typical levels when possible.
Classic Ready-to-Drink Protein Shakes
Food | Calories (kcal) | Protein (g) | Sat-Fat (g) | Sugar(g) |
Premier Protein Shake 30 g | 160 kcal | 30 g | 0.5 g | <1 g |
Premier Protein Shake (Strawberries & Cream) | 160 kcal | 30 g | 0.5 g | 1 g |
Core Power Chocolate Protein Shake | 200 – 230 kcal | 26 g | Varies | Varies |
Core Power Elite High Protein Shake | 230 kcal | 42 g | Varies | Varies |
Fairlife Nutrition Plan Chocolate | 150 kcal | 30 g | Unknown | 2 g |
BOOST High Protein Drink | 250 kcal | 20 g | 1-1.5 g | 11 g |
Carnation Breakfast Essential High Protein | 220 kcal | 15 g | Not listed | Not listed |
Pure Protein Complete Shake | 160-180 kcal | 30 g | Not listed | <1 g |
Highlights & What It Means
High-Protein Leaders
- Premier Protein drinks deliver 30 g protein with ~160 calories and very low sugar (~1 g) — ideal for muscle maintenance or meal replacement with minimal added sugar.
- Fairlife Nutrition Plan also provides 30 g protein and only ~2 g sugar, with moderate calories (~150).
- Pure Protein Complete offers 30 g protein with minimal sugar, similar to Premier but nutrition varies by formulation.
Higher Calorie/Meal-Style Options
- BOOST High Protein has 20 g protein with ~250 calories, but a notably higher sugar load (~11 g).
- Carnation Breakfast Essentials High Protein (often marketed as a nutritional breakfast drink) has ~15 g protein and ~220 calories — more of a balanced breakfast beverage.
Performance Shakes
- Core Power shakes from Fairlife come in standard (~26 g) and Elite (~42 g) protein versions — popular for post-workout recovery; calorie and sugar contents vary by flavor.
Saturated Fat Notes
- Most mainstream ready-to-drink protein shakes have low to moderate saturated fat (often <1 g to a few grams) when dairy-based or whey-based, but exact values can vary by brand and flavor. For example, Premier Protein’s shake has about 0.5 g saturated fat per 11 oz serving.
- Drinks with higher fat content (e.g., meal-replacement style or whole-milk-based drinks like some Core Power formulas) may have slightly more saturated fat.
Quick Takeaways
- Best for low sugar: Premier Protein, Pure Protein, and Fairlife Nutrition Plan shakes (all ~≤2 g sugar).
- Highest protein: Core Power Elite (~42 g).
- Best balanced: Products delivering ~20–30 g protein with moderate calories and low sugar are standard for muscle support or meal replacement.
- More calories + nutrition: BOOST/Carnation drinks can be better for extra energy but often with higher sugar and calories — closer to a nutrition shake than a pure protein drink.
Popular U.S. Cereals & Nutrition (per dry serving)
Here’s a summary of calories, protein, saturated fat, and sugar for some of the most popular breakfast cereals in the U.S. (based on top-selling lists like Cheerios, Frosted Mini-Wheats, Frosted Flakes, and other common favorites). Where possible, values are given per typical dry serving (without milk) — usually around 1 cup (28–60 g) depending on the cereal.
Popular U.S. Cereals & Nutrition (1 cup per dry serving: 28-60 g)
Food | Calories (kcal) | Protein (g) | Sat-Fat (g) | Sugar(g) |
General Mills Cheerios (original) | 100 kcal | 3 g | 0.5 g | 1-2 g |
Honey Nut Cheerios | 110 kcal | 3 g | 0.5 g | 9.6 g |
Kellogg’s Frosted Flakes | 130 – 140 kcal | 1 g | 0 g | 10 g |
Post Fruity Pebbles | 120 – 130 kcal | 1 g | 0 g | 9 – 12 g |
Frosted Mini-Wheats (Kellogg’s) | 190 – 210 kcal | 5 g | 0 g | 11 – 12 g |
Kellogg’s Corn Flakes | 100 kcal | 2 g | 0 g | 2 g |
Honey-Sweetened Cheerios/Multi-Grain | 130 – 150 kcal | 2 g | 0 g | 2 g |
Sweet or sugary children’s cereals (i.e., Golden Crisp, Apple Jacks) | 150 – 170 kcal | 1 – 2 g | 0 – 0.5 g | 13 – 18 g |
Post Shredded Wheat | 200 – 210 kcal | 6 – 7 g | 0 g | 0 g sugar (no added sugar) |
For cereals without specific data pulled from web (like Fruity Pebbles), typical values are approximated based on common nutrition labels. Always check the specific package for exact figures.
Notes on These Nutrients
- Calories: Most popular ready-to-eat cereals range roughly 90–210 calories per dry serving, depending on sugar and grain content.
- Protein: Many cereals are low in protein (1–5 g) unless fortified or specially formulated (e.g., high-protein cereals). Cheerios and mini-wheats provide more (~3–5 g).
- Saturated Fat: Generally low (often 0–0.5 g per serving), as cereals are grain-based and not high in fat.
- Sugar: This varies widely — “plain” cereals like original Cheerios and corn flakes are low (~1–2 g), while sweetened cereals often have 9–18 g sugar or more per serving.
Tips
- Serving sizes matter: Many people pour more than one “serving” into a bowl, which increases all nutrient values proportionally.
- Milk & toppings: Adding milk or fruit changes calories, protein, and sugar — e.g., 1 cup of cow’s milk adds ~80–100 calories and ~8 g protein.
- For health considerations, look beyond sugar: fiber, whole grains, and protein improve the nutritional quality of a cereal breakfast.
Here’s a nutrition comparison (calories, protein, saturated fat, sugar) of some of the top-selling and popular protein bars in the U.S. These values reflect typical servings of each bar — exact numbers can vary a bit by flavor or formulation.
*Estimate based on typical/brand nutrition profile (Exact labels vary by flavor).
High-Protein Bars
Food | Calories (kcal) | Protein (g) | Sat-Fat (g) | Sugar(g) |
David Protein Bar | 150 kcal | 28 g | 2-3 g | 0 claimed |
Quest Chocolate Chip Cookie Dough Protein Bar | 190 kcal | 21 g | 2.5 g | 1 g |
Bareballs Creamy Crisp Protein Bar | 200 kcal | 20 g | 3-4 g | 1 g |
Think! High Protein Bars Creamy Peanut Butter | 230 kcal | 20 g | 3.5 g | 0 claimed |
Pure Protein Galactic Brownie Protein Bar | 200 kcal | 20 g | 3 g | 2 g |
RXBAR Chocolate Sea Salt Protein | 210 kcal | 12 g | 3 g | 13 g (from dates) |
Pure Protein Chocolate Deluxe Bar | 180 kcal | 20 – 22 g | 3 g | 3 g |
Perfect Bar Dark Chocolate Chip Peanut Butter Bar | 340 kcal | 16 – 17 g | 7 g | 11 g |
*Estimate based on typical/brand nutrition profile (Exact labels vary by flavor).
Notes on These Bars
- David Protein Bars are among the lowest-calorie, highest-protein rated mainstream bars, often marketed with ~28 g protein and minimal sugar.
- Quest Bars are a low-sugar, higher-fiber choice with ~21 g protein and ~1 g sugar.
- Barebells & think! Bars balance taste with macros — ~20 g protein and moderate calories.
- Pure Protein bars are classic gym snack staples with ~20 g protein and low sugar.
- RXBARs use whole-food ingredients (dates/nuts), giving you moderate protein but more natural sugar.
- Perfect Bars are more of a nutrient-dense, higher-calorie bar with real nut butter — great for meal-replacement but higher in fat and sugar.
What to Watch
- Sugar amounts can come from added sugars, naturally occurring fruit sugars, or sugar alcohols — nutrition labels sometimes list these differently.
- Some bars contain sugar alcohols (e.g., Quest), which don’t count toward “sugar” on the label but can affect net carbs and digestion.
- Saturated fat varies by bar source (nuts vs. isolates vs. added oils).
Here are the key nutrition facts — calories, protein, saturated fat, and sugar — for some of the top and most common PowerBar bars in the U.S. These aren’t all protein bars (some are energy bars), but they’re among the main PowerBar products still widely referenced:
Popular PowerBar Bars & Their Nutrition (per bar)
Food | Calories (kcal) | Protein (g) | Sat-Fat (g) | Sugar(g) |
Powerbar 30% Protein Plus Bar (classic protein bar) | 210 kcal | 20 g | 3 g | 12 g |
PowerBar Protein Plus Chocolate Peanut Butter Protein Bar (reduced sugar version) | 210 kcal | 22 g | 3 g | 1 g (reduced sugar) |
Classic ProteinPlus – Vanilla Yogurt (generic) | 300 kcal | 23 g | 3.5 g | 19 g |
Classic ProteinPlus – Vanilla Yogurt (generic) | 300 kcal | 23 g | 3.5 g | 19 g |
PowerBar Chocolate Peanut Butter Performance Energy Bar (performance, not protein focus) | 230 – 240 kcal | 9 g | 1 g | 26 g |
Powerbar Energize Original Bar (classic energy bar) | 199 – 203 calories | 6 – 7 g | 0.4 g | 21-24 g |
52% High-Protein Low Sugar Bar (Powerbar high-protein formula) | 165 kcal | 26 g | 2 g | 0.7 g |
Notes
- ProteinPlus bars are PowerBar’s main post-workout protein bars, with roughly 20–23 g protein per bar and moderate sugar.
- Reduced-sugar versions (like the Chocolate Peanut Butter ProteinPlus) can drop sugar dramatically (~1 g) while keeping protein high — but exact macros vary by product/formulation. (Product listing info; exact label may differ flavor-to-flavor.)
- Energy-oriented PowerBars like Performance Energy and Energize Original are designed for carbs + quick energy more than protein — so protein is lower and sugar is higher.
- The 52% Protein+ High-Protein Low Sugar variant is one of PowerBar’s highest protein offers relative to calories (~26 g per ~165 kcal).
How to Choose Based on Goals
- Muscle recovery → choose ProteinPlus or High-Protein Low Sugar bars for higher protein.
- Pre-workout energy → choose Energize Original or Performance Energy for carbs and quick fuel.
- Lower sugar → the High-Protein Low Sugar or reduced-sugar ProteinPlus options are better.
Here’s a summary of calories, protein, saturated fat, and sugar for many of the most commonly eaten American desserts, based on typical single-servings from nutrition databases (these can vary by recipe, brand, and portion size).
Classic U.S. Desserts – Typical Nutrition (per standard serving)
Food | Calories (kcal) | Protein (g) | Sat-Fat (g) | Sugar(g) |
Ice Cream 1 cup | 267 kcal | 5 g | 8.8 g | 30 g |
Soft Serve 1 cup | 384 kcal | 7 g | 12. 9 g | 38 g |
Ice Cream Sundae 1 cup | 365 kcal | 5 g | 11.9 g | 43 g |
Chocolate Mousse 1 cup | 355 kcal | 7 g | 14.8 g | 27 g |
Pudding 1 cup | 288 kcal | 8 g | 3.2 g | 51 g |
Apple Pie 1 slice | 411 kcal | 4 g | 4.7 g | 58 g |
Cheesecake 1 slice | 640 kcal | 10 g | 25 g | 21 g |
Chocolate Cake w/Frosting 1 slice | 235 kcal | 3 g | 10.5 g | 35 g |
Brownie 1 piece | 243 kcal | 3 g | 10g | 39 g |
Chocolate Chip Cookie Large Bakery Size | 730+ kcal | 5 g | 21 g | 47 g |
Biscoff Cheesecake (Crumbl) | 790 kcal | 11 g | 30 g | 36 g |
Aloha Pie (Crumbl) | 730 kcal | 6 g | 29 g | 63 g |
*Sugar estimates are from typical carbohydrate values (carbs ≈ mostly sugar in desserts). Exact sugar content varies a lot by recipe.
Notes on These Desserts
Ice Cream:
• Full-fat ice cream is a high-calorie dessert with substantial saturated fat and sugar mostly from added sweeteners and milk fat.
Pies & Cakes:
• Cheesecake is one of the highest in calories and saturated fat due to cream cheese and butter-rich crusts.
• Standard apple pie is calorie-dense and high in sugar (fruit sugars + crust sugars).
Brownies & Cookies:
• Brownies often combine saturated fat (butter, chocolate) with added sugar, making them calorie-rich.
• Small cookies might be lower in calories, but large bakery versions (e.g., Crumbl large cookies) can be very high.
Typical Dessert Nutrient Trends
- Calories: Desserts are usually energy-dense; single servings often range from ~200 to 800+ calories depending on size and ingredients.
- Protein: Most traditional desserts are low in protein (2–10 g), unless ingredients like dairy or nuts add extra.
- Saturated Fat: Rich ingredients (cream, butter, chocolate) drive saturated fat, often 5–30+ grams per serving in cakes and cheesecakes.
- Sugar: Sugar is a major component, typically 30–60+ grams per serving in sweet desserts; fruit-based or pudding desserts vary widely.
Snacks and Bars
Food | Calories (kcal) | Protein (g) | Sat-Fat (g) | Sugar(g) |
Power Up High Energy Trail Mix ¼ cup | 150 kcal | 2 g | 3 g | 10 g |
Power Up Protein Mix ¼ cup | 200 kcal | 7 g | 2 g | 7 g |
Power Up Mega Omega ¼ cup | 140 kcal | 3 g | 1 g | 12 g |
Lance Nekot Peanut Butter 1 pack | 240 kcal | 4 g | 2.5 g | 12 g |
Kind Dark Chocolate Nuts & Sea Salt Bar | 190 kcal | 6 g | 3 g | 4 g |
Kind Caramel Almond & Sea Salt Bar | 170 kcal | 6 g | 3 g | 4 g |
Kind Protein MAX Snack Bar | 240-250 kcal | 20 g | 4.5 – 5 g | Less than 1 g |
Kind Zero Added Sugar Bar Caramel Almond & Sea Salt | 140 kcal | 5 g | 2.5 g | Less than 1 g |
Here’s some of the most popular fast-food desserts in the U.S. — focusing on calories, protein, saturated fat, and sugar — based on standard or regular serving sizes. Values are approximate and can vary by location, size, and specific variations of items.
McDonald’s Standard Portions
Food | Calories (kcal) | Protein (g) | Sat-Fat (g) | Sugar(g) |
Vanilla Cone | 200 kcal | 5 g | 2 g | 23 |
Baked Apple Pie | 230 kcal | 2 g | 6 g | 14 g |
Chocolate Chip Cookie | 170 kcal | 2 g | 3.5 g | 15 g |
Hot Fudge Sundae | 330 kcal | 7 g | 8 g | 45 g |
Caramel Sundae | 340 kcal | 7 g | ?? | 46 g |
McFlurry with Oreo (reg) | 510 kcal | 12 g | 16 g | 64 g |
McFlurry with M&Ms (reg) | 640 kcal | 13 g | 22 g | 86 g |
Small Chocolate Shake | 510 kcal | 11 g | 14 g | 67 g |
Dairy Queen
Food | Calories (kcal) | Protein (g) | Sat-Fat (g) | Sugar(g) |
Dairy Queen Medium French Silk Pie Blizzard | 1000 kcal | 20 g | 25 g | 103 g |
Dairy Queen Large Brownie Dough Blizzard (extreme) | 1400 kcal | 27 g | 32 g | 150 g |
Dairy Queen Blizzard (large, candy flavored flavors) | 1300-1450 kcal | 25 – 30 g | 30 – 35 g | 140 – 155 g |
Dairy Queen Blizzard (medium, most flavors) | 850 -1000 kcal | 18 – 22 g | 22 – 28 g | 95 – 110 g |
Dairy Queen Small Chocolate Sundae | 270 kcal | 6 g | ?? | 41 g |
Dairy Queen Kid-Size Vanilla Cone | 160 kcal | 4 g | ? | 18 g |
Taco Bell Cinnabon Delights (2-pack) | 170 kcal | 2 g | ? | 9 g |
Culver’s
Food | Calories (kcal) | Protein (g) | Sat-Fat (g) | Sugar(g) |
Single Scoop Ice Cream-Style Custard (dish) | 310 kcal | 5 g | 11 g | 27 g |
Double Scoop Custand (dish) | 590 kcal | 10 g | 22 g | 52 g |
Culver’s Shake (small/regular) | 660 kcal | 12 g | 23 g | 62 g |
Concrete Mixer (small) | 630 kcal | 17 g | ? | 81 g |
Banana Split (2 scoops) | 1090 kcal | 15 g | 28 g | 91 g |
Sonic
Food | Calories (kcal) | Protein (g) | Sat-Fat (g) | Sugar(g) |
Hot Fudge Real Ice Cream Sundae | 520 kcal | 6 g | 15 g | 46 g |
Caramel Real Ice Cream Sundae | 510 kcal | 6 g | 15 g | 46 g |
Chocolate Real Ice Cream Sundae | 500 kcal | 6 g | 14 g | 50 g |
Strawberry Real Ice Cream Sundae | 440 kcal | 6 g | 14 g | 40 g |
Vanilla Soft Serve Dish (no toppings) | 300 kcal | 7 g | 10 g | 40 g |
Sonic Blast, Made with M & M’s (small) | 870 kcal | 12 g | 31 g | 80 g |
Chocolate Chip Cookie Dough Sonic Blast (mini) | 450 kcal | 6 g | 12 g | 37 g |
Small Classic Shakes | 560 – 620 kcal | 10 – 12 g | 23 – 28 g | 70 – 80 g |
Chick-fil-A
Food | Calories (kcal) | Protein (g) | Sat-Fat (g) | Sugar(g) |
Cookies & Cream Milkshake (regular) | 630 kcal | 13 g | 15 g | 84 g |
Chocolate Milkshake (regular) | 590 kcal | 12 g | 14 g | 90 g |
Strawberry Milkshake (regular) | 590 kcal | 11 g | 13 g | 88 g |
Vanilla Milkshake (regular) | 580 kcal | 13 g | 15 g | 80 g |
Chocolate Chunk Cookie | 370 kcal | 5 g | 9 g | 26 g |
Chocolate Fudge Brownie | 370 kcal | 4 g | 8 g | 35 g |
Icedream Cup | 140 kcal | 4 g | 2.5 g | 24 g |
Icedream Cone | 180 kcal | 4 g | 2.5 g | 25 g |
Frosted Lemonade | 320 kcal | 6 g | 3.5 g | 63 g |
Frosted Coffee | 230 kcal | 6 g | 3.5 g | 39 g |
Shake Shack
Food | Calories (kcal) | Protein (g) | Sat-Fat (g) | Sugar(g) |
Vanilla Shake (regular) | 680 kcal | 18 g | 22 g | 71 g |
Chocolate Shake (regular) | 750 kcal | 16 g | 27 g | 69 g |
Cookies & Cream Shake (regular) | 850 kcal | 19 g | 24 g | 86 g |
Salted Caramel Shake (regular) | 840 kcal | 17 g | 26 g | 96 g |
Black & White Shake (regular) | 770 kcal | 19 g | 26 g | 76 g |
Single Vanilla Custard Cup | 280 kcal | 7 g | 9 g | 30 g |
Double Vanilla Custard Cup | 450 kcal | 11 g | 14 g | 48 g |
Single Chocolate Cup | 310 kcal | 6 g | 11 g | 29 g |
Double Chocolate Cup | 490 kcal | 9 g | 18 g | 47 g |
Loaded Chocolate Cookies & Cream Shake | 1,160 kcal | 17 g | 32 g | 108 g |
Oreo Funnel Cake Shake | 1,080 kcal | 19 g | 29 g | 100 g |
Typical Ranges at Shake Shack
- Calories: ~280–1,160+ (higher for specialty shakes)
- Protein: ~6–19 g per item (higher in shakes than plain custard cups)
- Saturated Fat: ~9–32 g (highest in richer shakes)
- Sugar: ~30–108 g (very high in milkshake desserts)
*Compiled using ChatGPT.
The Bottom Line
Although there is no fixed gram-per-day sugar limit under the 2025-2030 US Dietary Guidelines like the previous guidelines of the ~50 g/day rule — but the recommendation is to focus on minimizing or avoiding added sugars overall while keeping them to ≤10 g per meal if consumed. Translation: 3 meals/day = 30 grams/day of added sugar.
But when you look at the tables above, they will educate you and your family about lots of sweet choices from milkshakes to candy bars to sweetened cereal to protein bars you may want to avoid or eat less of.
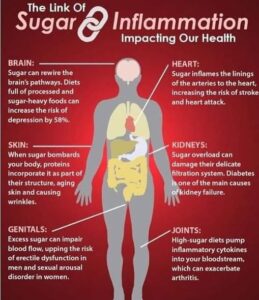
Remember, research has concluded sugar is the major culprit that causes many of the diseases we see in Americans today: from obesity to heart disease, from cancer to diabetes.
Eat more of the best and less of the rest!